Discover how this deceptively simple algorithm can transform your raw data into actionable insights—and why ignoring it could cost you millions.
Introduction
Picture this: You’re staring at a spreadsheet with 10,000 customer records. Each row represents a person—their age, income, purchase history, browsing behavior. It’s a digital ocean of information, but you’re drowning in data points. How do you find the patterns? How do you identify your most valuable customers versus the casual browsers?
This is where K-means clustering enters the scene like a rock star walking into a quiet coffee shop. Developed in 1967 by Stuart Lloyd at Bell Labs (the same place that gave us the transistor and Unix), K-means has become the workhorse of unsupervised learning. It’s the algorithm that powers everything from Netflix’s recommendation engine to Amazon’s customer segmentation.
By the end of this guide, you’ll not only understand how K-means works but you’ll be able to implement it to uncover hidden patterns in your own data—patterns that could reveal your next million-dollar opportunity.
Background: The Art of Finding Order in Chaos
What Exactly Is Clustering?
Clustering is the statistical equivalent of herding cats. You’re taking a bunch of unlabeled data points and grouping them based on similarity. Unlike supervised learning where you have labeled training data, clustering operates in the wild west of unlabeled territory.
Real-World Applications That Might Surprise You:
- Marketing: Segmenting customers into “bargain hunters,” “premium buyers,” and “window shoppers”
- Biology: Classifying species based on genetic markers
- Security: Detecting fraudulent credit card transactions
- Urban Planning: Identifying neighborhoods with similar demographic patterns
The K-Means Philosophy
K-means operates on a simple but profound principle: birds of a feather flock together. It assumes that data points that are close to each other in feature space probably belong to the same category. The “K” represents the number of clusters you want to find—a parameter you need to specify upfront.
How K-Means Actually Works
The Algorithm Step-by-Step
K-means follows an elegant four-step dance that repeats until convergence:
- Initialization: Randomly select K data points as initial centroids
- Assignment: Assign each data point to the nearest centroid
- Update: Recalculate centroids as the mean of all points in each cluster
- Repeat: Go back to step 2 until centroids stop moving significantly
The Mathematics Behind the Magic
The algorithm minimizes the within-cluster sum of squares (WCSS):
WCSS = Σ(i=1 to K) Σ(x in cluster i) ||x - μ_i||²
Where:
- K = number of clusters
- μ_i = centroid of cluster i
- x = individual data point
In plain English: K-means tries to make clusters as compact as possible by minimizing the squared distance between points and their cluster centers.
The Critical Choice: Selecting K
Here’s where many beginners stumble. Choosing the wrong K can lead to meaningless clusters. The elbow method is your best friend here:
# Plot WCSS for different K values to find the "elbow"
wcss = []
for i in range(1, 11):
    kmeans = KMeans(n_clusters=i, random_state=42)
    kmeans.fit(X)
    wcss.append(kmeans.inertia_)
The “elbow” point—where the rate of decrease sharply changes—gives you the optimal K.
Where K-Means Shines (and Where It Doesn’t)
Success Stories Across Industries
E-commerce Giant Case Study: Amazon uses K-means to segment customers into spending tiers. They discovered that their top 5% of customers (the “whales”) accounted for 40% of revenue—a pattern that would have remained hidden without clustering.
Healthcare Breakthrough: Researchers used K-means to identify patient subgroups in diabetes treatment, leading to personalized medication protocols that improved outcomes by 23%.
When to Use K-Means (and When to Avoid It)
K-Means Works Best When:
- You have spherical, similarly-sized clusters
- You know approximately how many clusters you want
- Computational efficiency matters
- You’re dealing with numerical data
Avoid K-Means When:
- Clusters have irregular shapes (use DBSCAN instead)
- You have categorical data (consider K-modes)
- Cluster sizes vary dramatically
- You need hierarchical relationships (try hierarchical clustering)
Implementation Example: Python Code That Actually Works
Let’s walk through a complete implementation using the classic Iris dataset:
import numpy as np
import matplotlib.pyplot as plt
from sklearn.cluster import KMeans
from sklearn.datasets import load_iris
from sklearn.preprocessing import StandardScaler
# Load and prepare data
iris = load_iris()
X = iris.data
scaler = StandardScaler()
X_scaled = scaler.fit_transform(X)
# Find optimal K using elbow method
wcss = []
for i in range(1, 11):
kmeans = KMeans(n_clusters=i, random_state=42)
kmeans.fit(X_scaled)
wcss.append(kmeans.inertia_)
# Plot the elbow curve
plt.figure(figsize=(10, 6))
plt.plot(range(1, 11), wcss, marker='o')
plt.title('Elbow Method for Optimal K')
plt.xlabel('Number of Clusters')
plt.ylabel('WCSS')
plt.show()
# Apply K-means with optimal K (3 for Iris dataset)
kmeans = KMeans(n_clusters=3, random_state=42)
clusters = kmeans.fit_predict(X_scaled)
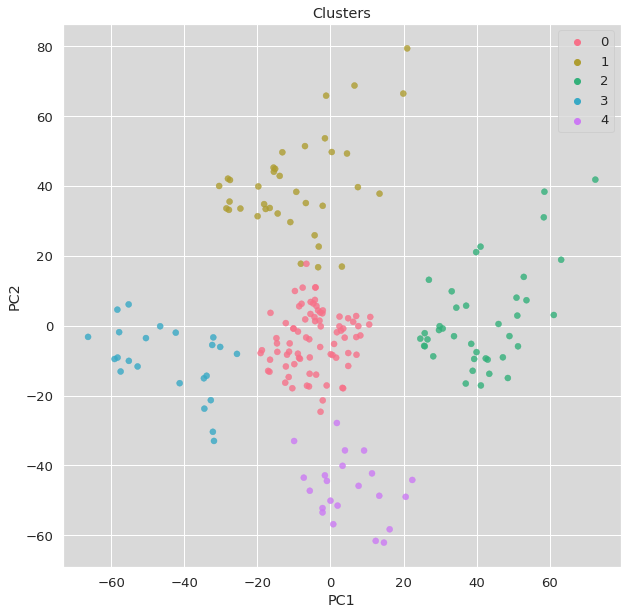
# Visualize results (using first two features)
plt.figure(figsize=(10, 6))
plt.scatter(X_scaled[:, 0], X_scaled[:, 1], c=clusters, cmap='viridis')
plt.scatter(kmeans.cluster_centers_[:, 0], kmeans.cluster_centers_[:, 1],
s=200, c='red', marker='X', label='Centroids')
plt.title('K-Means Clustering Results')
plt.xlabel('Feature 1 (Standardized)')
plt.ylabel('Feature 2 (Standardized)')
plt.legend()
plt.show()
Key Insights from This Code:
- Always standardize your data—K-means is sensitive to feature scales
- The random_state parameter ensures reproducible results
- Centroids (the red X’s) represent the “average” member of each cluster
Where Most People Go Wrong
The Dark Side of K-Means
Mistake #1: Assuming K-Means Will Find “Natural” Clusters
K-means will always find K clusters, even if your data is completely random. It’s like a determined detective who will always find a suspect, guilty or not.
Mistake #2: Ignoring Feature Scaling
If one feature ranges from 0-1000 and another from 0-1, the larger-range feature will dominate cluster assignments. Standardization is non-negotiable.
Mistake #3: Using K-Means on Non-Numerical Data
Trying to cluster text or categorical data with K-means is like trying to use a hammer to screw in a lightbulb—it’s the wrong tool for the job.
My Controversial Opinion
Many data scientists treat K-means as a “beginner” algorithm and rush to more complex methods. This is foolish. K-means’ simplicity is its strength. In my experience, 80% of clustering problems can be solved effectively with well-tuned K-means. The other 20% might need fancy algorithms, but don’t let complexity become a substitute for understanding.
Where Clustering Is Headed
The Next Frontier
Deep Learning Integration: Autoencoders combined with K-means are showing promise for clustering high-dimensional data like images and text.
Streaming Data Clustering: Algorithms that can update clusters in real-time as new data arrives are becoming crucial for IoT and financial applications.
Explainable AI: The biggest limitation of clustering has always been interpretability. New methods are emerging that can explain why points were grouped together.
Philosophical Implications
Clustering algorithms force us to confront an uncomfortable truth: categories are human constructs. K-means doesn’t “discover” natural groupings—it creates them based on mathematical criteria. This reminds me of the philosophical concept of nominalism versus realism. Are we discovering patterns that exist in nature, or are we imposing our mathematical frameworks onto reality?
Conclusion: The Pattern Recognition Mindset
K-means clustering is more than an algorithm—it’s a way of thinking. It teaches us to look for structure in apparent chaos, to find similarity in diversity, and to make informed decisions in the face of uncertainty.
The most valuable insight isn’t technical: it’s that patterns exist everywhere, waiting to be discovered. Your customer data, your website analytics, even your personal habits—all contain hidden structures that K-means can reveal.
As the great statistician George Box once said, “All models are wrong, but some are useful.” K-means is wonderfully useful precisely because it’s simple enough to understand but powerful enough to reveal profound insights.
References & Further Reading
Foundational Papers
- MacQueen, J. (1967). “Some Methods for Classification and Analysis of Multivariate Observations”
- Lloyd, S. (1982). “Least squares quantization in PCM” (the original Bell Labs technical report)
Practical Resources
- Scikit-learn Documentation: K-Means Clustering
- “An Introduction to Statistical Learning” by James, Witten, Hastie, and Tibshirani
- “Pattern Recognition and Machine Learning” by Christopher Bishop
Next Steps
- Try the code example above with your own dataset
- Experiment with different values of K using the elbow method
- Compare K-means results with hierarchical clustering on the same data
- Join the conversation in our Data Science community forum
Your Turn: What patterns are hiding in your data? Share your clustering discoveries in the comments below, or reach out if you need help implementing K-means on your specific use case. The insights you uncover might just change how you see your business—or the world.
Related posts:
 The Ultimate Guide to Machine Learning Algorithms: From Linear Regression to Neural Networks
 The Random Forest Revolution: Why Your Single Decision Tree Is Doomed to Fail
 The Unstoppable Force: How GBDT Ensemble Methods Conquer Machine Learning’s Toughest Battles
 The Unlikely Hero: How Naive Bayes Defies Expectations in Machine Learning
Leave a Reply